Holidays in Canada Infographic
Data and Information Society
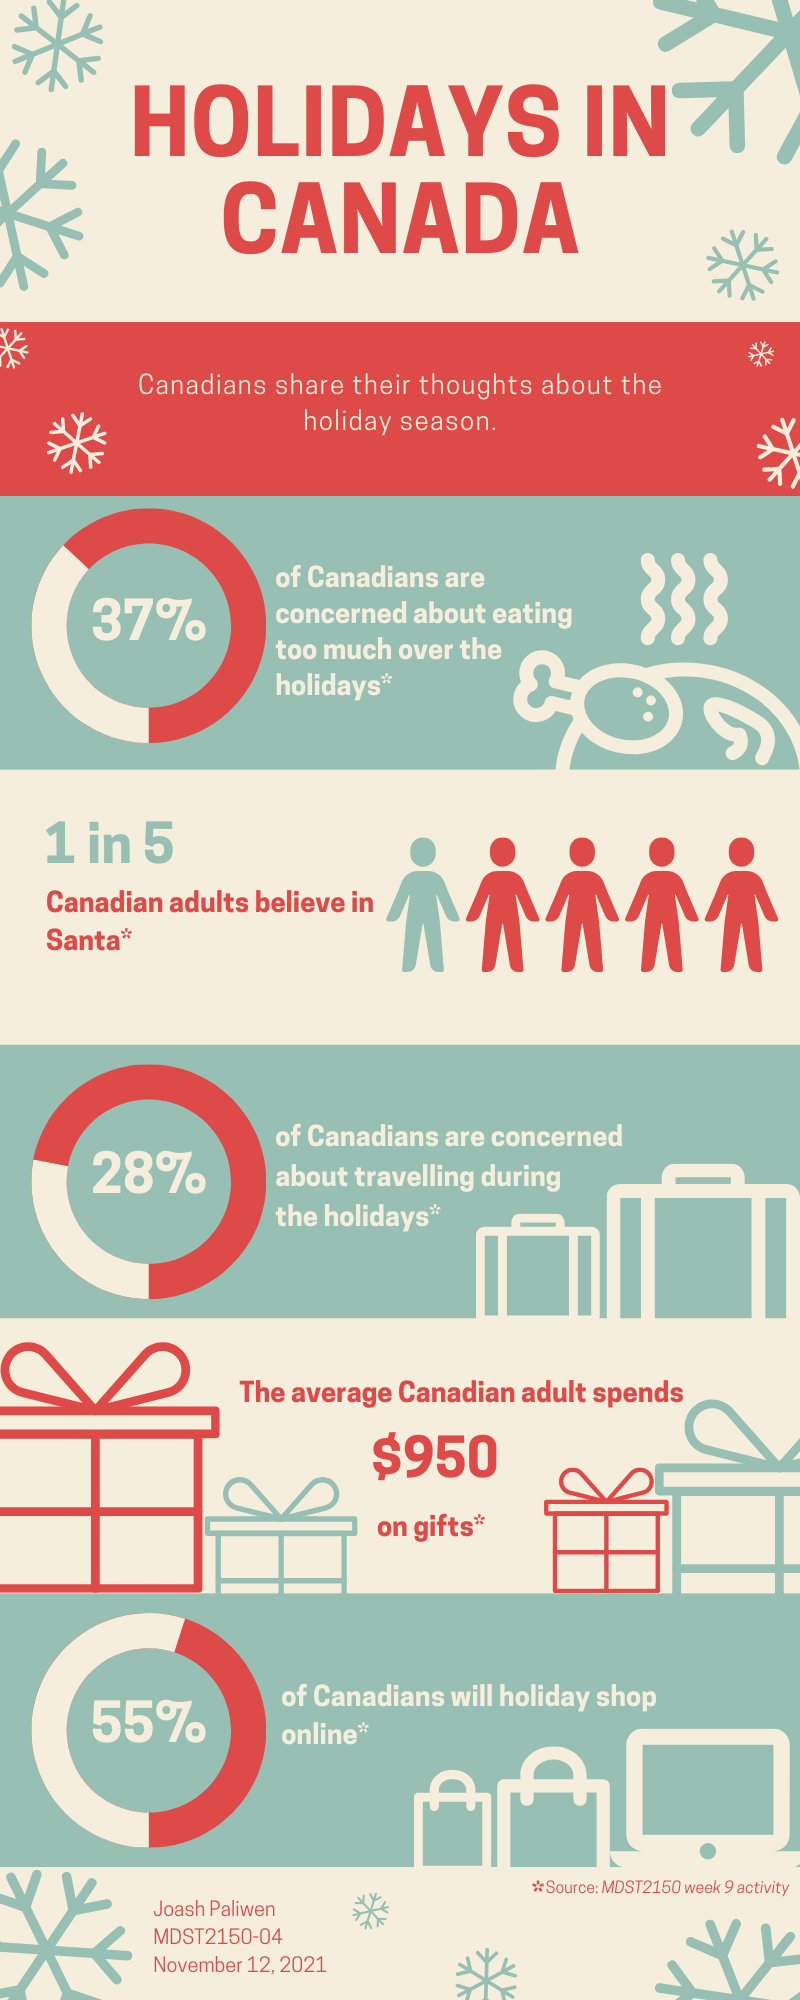
I created an infographic for this class activity where we were given data about the holiday season in Canada. Our task was to design an infographic using the provided data. I made the infographic easy to understand by using appropriate graphs and keeping the design simple. I selected a consistent colour scheme for the infographic and incorporated graphics to enhance its visual appeal.
Made with: Canva
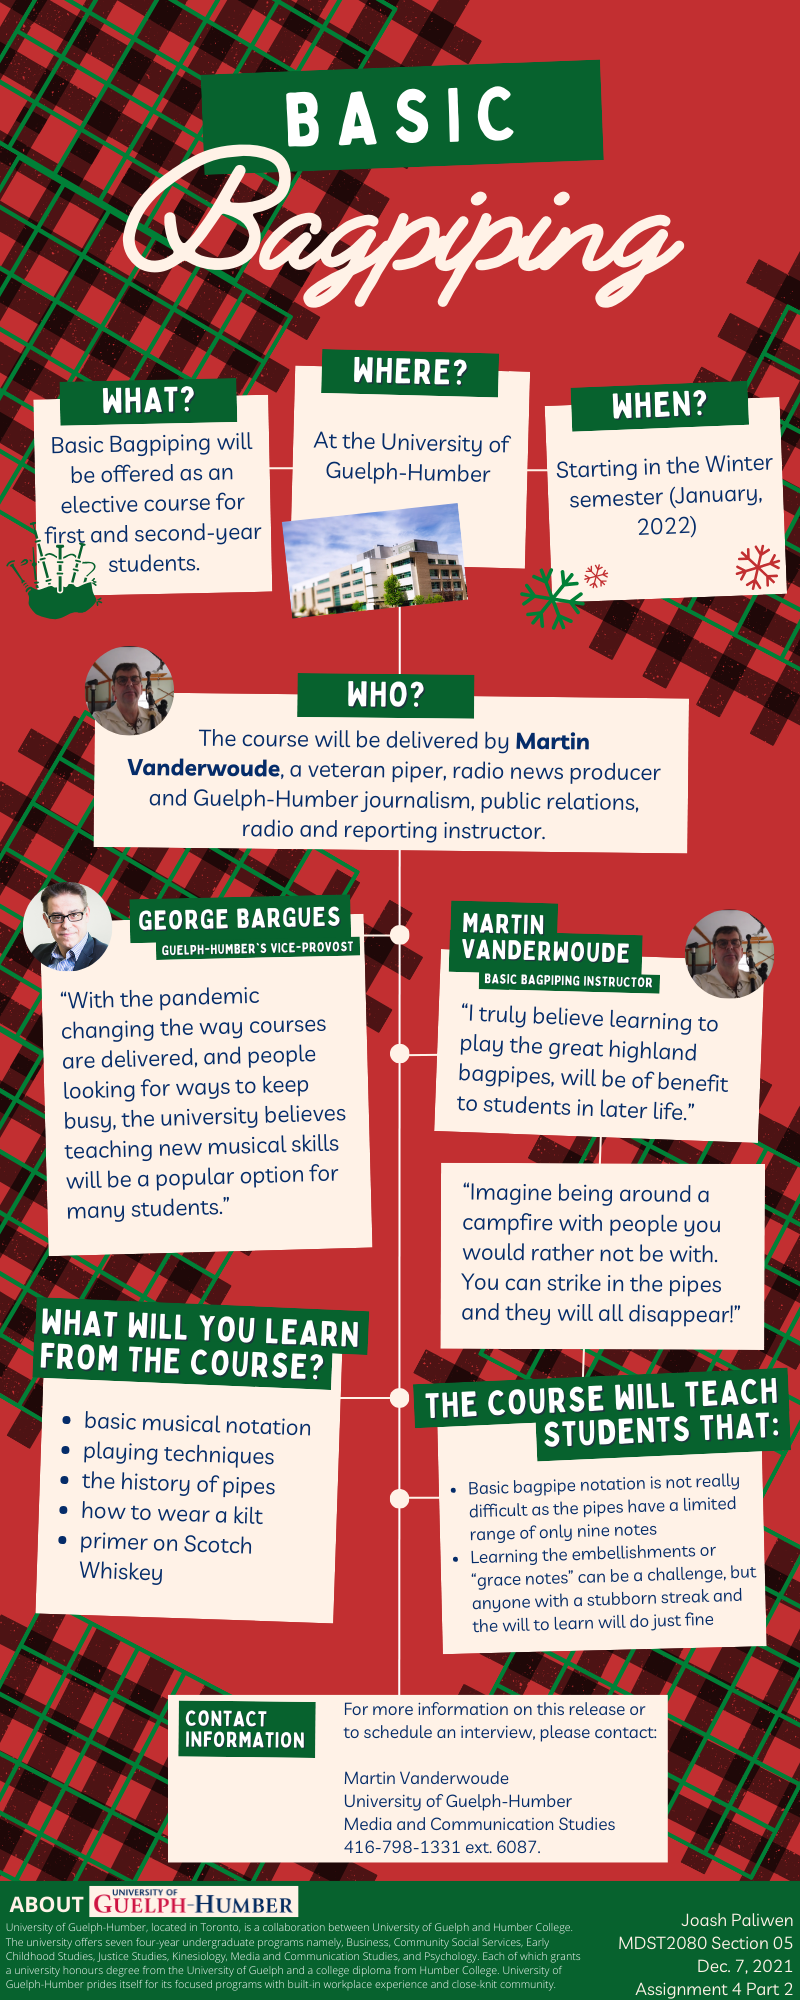
Basic Bagpiping Course Infographic
Writing and Research for Media and Communications Studies 2
In this assignment, we’re tasked with designing an infographic based on the transcript and fact sheet about our university’s announcement of a new bagpiping course. I thoroughly reviewed the fact sheet and noted the essential course details and key points that answer the fundamental questions: who, what, when, and where. Then, I organized these key points into text boxes within the infographic to create a visually appealing and structured presentation. Additionally, I incorporated bagpiping colours and patterns to capture the essence and spirit of the course.
Made with: Canva